1 / 10
0/0 correct
You’re practising as a guest — this drill won’t be saved. Sign in to keep your progress.
1Question 1 of 10Reading & Writing
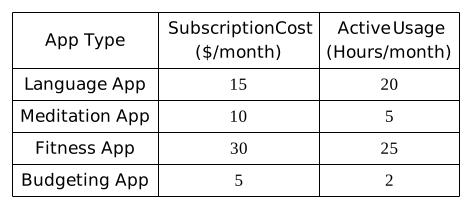
Type: Bar Graph
X-axis: App Type
Y-axis (Left): Subscription Cost ($/month)
Y-axis (Right): Active Usage (Hours/month)
Legend: Cost, Usage
Market researchers studying the "subscription economy" hypothesize that consumers are only willing to tolerate a high monthly subscription cost (defined as over $20) if the digital service effectively replaces a physical, real-world expense, such as a gym membership or in-person classes. The researchers point to the usage and cost data of various apps as evidence, noting that _______.
Which choice most effectively uses data from the graph to complete the statement?